

We all know that Microsoft Excel is an important tool for professionals across various industries. It provides robust capabilities for data analysis, financial modeling, and data visualization. Do you know the arrival of some advanced Excel courses are creating employment opportunities? Let us look at some popular courses that are currently proving their importance in multiple industries, including software.

What is advanced Excel Courses?
As a fresher, when you gradually progress from basic to advanced level Excel skills, you gain the ability to handle complex data tasks, automate processes, and make informed, data-driven business decisions. Advanced Excel is used to train and prepare the individuals who learn it to manage the full potential of the application and in turn enhance their productivity and analytical capabilities.
Advanced Excel courses are mainly used to master the more complex features of Excel, making them ideal for professionals who want to enhance their data analysis and reporting skills. Here is a general list of commonly used advanced excel topics.
Data Analysis and Visualization
Data analysis is conducted to understand the trends, groupings, or specific relationships among different types of data. This is achieved through systematic methods. Data visualization is another process that involves presenting this data in charts, graphs, or other visual formats to facilitate data analysis and interpretation, providing a clearer picture of ongoing trends. This aids businesses in making informed decisions. Visualizing data in Excel improves the representation of numerical data in a more accessible visual format, such as line graphs, Gantt charts, or other types of graphs. Let us see some examples.
- Advanced Formulas: INDEX-MATCH, Array formulas, IFERROR, SUMIFS, etc.
- Power Query: Used for importing, cleaning, and transforming data.
- Pivot Tables & Pivot Charts: To create advanced summaries and dynamic reports.
- Data Visualization: Using charts such as Waterfall, Funnel, and Sparklines.
Power BI Integration
Power BI – powerful business intelligence tool from Microsoft that helps users to visualize and share insights from their data. It allows its users to connect to a wide different data sources, including flat files, SQL databases, Azure cloud, web platforms like Facebook and Google Analytics, as well as 3rd-party applications.
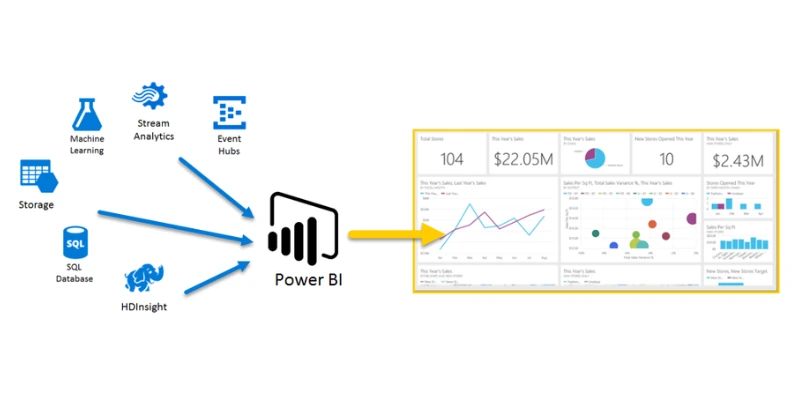
Through Power BI integration, data from these sources can be combined to create a single source of truth, improving data quality, workflow, and visualization. Power BI’s reporting capabilities empower users to generate accurate reports and easily share them with different teams and stakeholders. Overall, Power BI is a versatile tool that can greatly enhance decision-making and data-driven strategies within an organization.
Macros and VBA (Visual Basic for Applications)
These are powerful tools used in Microsoft Excel and other Microsoft Office applications to automate repetitive tasks and create custom functionality. Macros are nothing brecorded sequences of actions that can be played back to automate tasks, such as formatting data, generating reports, or performing calculations. VBA, on the other hand, is a programming language that helps users to create and customize macros with more advanced features and logic. With VBA, users can automate complex procedures, interact with other applications, and create custom forms and functions. Both Macros and VBA provide users with the ability to streamline workflows, increase productivity, and extend the capabilities of Microsoft Office applications.
The Visual Basic for Applications (VBA) isa the latest powerful programminglanguage that facilitates users to automate tasks and createcustomized solutions within Microsoft Excel. One of thekey features of VBA is its ability tocreate macros, which are sets of instructions that automaterepetitive tasks. These macros can be createdby recording user actions or by writing VBA code manually. VBA and macros are widelyused to speed upmanual processes, create custom functions,and interact with other Microsoft Office applications such as Word and Access. Advance excel topics are never complete without Macros and VBA.
Data validation and conditional formatting
Both these are essential tools in data management and analysis. Data validation ensures that the data entered into a spreadsheet meets specific criteria, such as date ranges, numerical limits, or predefined lists. This helps maintain data accuracy and consistency. On the other hand, conditional formatting allows users to visually highlight and emphasize important information based on certain conditions. For example, cells containing values above a certain threshold can be automatically formatted with a different color, making it easier to identify trends or outliers within the data. Overall, these features play a crucial role in ensuring data integrity and making it more accessible for analysis and decision-making. Mastering these above technologies would answer questions like “What is advance Excel, and its impact on your software career?”.
Conditional formattingof Excel is yet another powerful tool that allows users to automatically format cellsbased on specific criteria. This feature makes it easy to highlight important values and identify trends, and visualize data by applying different formatting styles. By setting up rules, such as highlighting cells that meet certain conditions or contain specific values, conditional formatting helps to emphasize key insights and make data easier to interpret at a glance. With options like color shading, data bars, icons, and more, conditional formatting provides a flexible way to visually enhance spreadsheets and make important information stand out.
Dashboards and reporting
Dashboards and Reporting always play a crucial role in modern business operations. Dashboards provide a visually appealing representation of key performance indicators and important business data, allowing for real-time monitoring and quick access to critical information. There are different types of dashboards, such as operational, strategic, and analytical, each serving specific purposes in decision-making processes. Reporting automation and dynamic dashboards using tools like Excel enable businesses to efficiently generate and interact with reports, saving time and costs while empowering users to derive actionable insights. Overall, dashboards and reporting are essential tools for arriving at informed decision-making and maintaining a competitive edge in the current business environment. Job vacancy for freshers will be wide open if they are opting for these courses in Excel.
Creating and utilizing reporting dashboards isessential for businesses to make informed, real-time decisions. Whetherit’s an operational dashboard for monitoring processes, a strategic dashboard for a high-level businessoverview, or an analytical dashboard for identifying trends, these tools providevaluable insights. The latest free job alert are now available online if you master any of the topics in Excel. Dashboards allow key performance indicators and business data to be visually represented and interactively accessed, empowering users to derive actionable insights while saving time and costs. Dynamic dashboards, with interactive elements like charts and slicers, and reporting automation through tools like Excel, further enhance the effectiveness of dashboard reporting in delivering valuable business intelligence.
In conclusion, mastering advanced Excel courses offers numerous benefits and opportunities for personal and professional development of the candidates. Proficiency in advanced Excel prepares individuals with powerful data analysis, visualization, and automation skills, enabling them to arrive at decisions and drive efficiency in their work. These skills are highly in need after in various industries, making candidates more competitive in the job market and opening doors to new career opportunities. Investing good amount of time in advance Excel training ultimately leads to improved problem-solving capabilities, greater confidence in handling complex data tasks, and the potential for career growth, transforming the way how individuals approach data and positioning them as valuable assets in their organizations.