

Data science, an interdisciplinary field, extracts valuable insights from raw data through analysis, leveraging various technologies like statistics, computer science, machine learning, deep learning, data analysis, and data visualization. Over time, data science has gained widespread significance owing to the value of data, often referred to as the new oil of the future. Proper analysis and utilization of data can yield substantial benefits for stakeholders. Furthermore, Data Scientists have the opportunity to work across diverse domains, tackling real-world problems using cutting-edge technologies.

Moreover, data science is increasingly utilized in fraud detection applications within credit-based financial systems. By analyzing patterns and anomalies in data, data scientists help detect and prevent fraudulent activities, safeguarding financial transactions. A proficient data scientist can interpret data, innovate solutions, and demonstrate creativity, contributing to business success and strategic objectives. Given its multifaceted applications and high impact, data science emerges as one of the most lucrative career paths in the 21st century. Several companies are hiring for Data Scientists and Analysts currently. To crack the interview with ease and confidence, Freshers Jobs will guide you with the top 50 Data Science Interview Questions and Answers.
Data Science Interview Questions and Answers
Below given are the Data Science Interview Questions along with the answers that will assist freshers with important and frequently asked questions and answers.
Data Science Interview Questions
- What do you mean by Data Science?
An interdisciplinary subject known as “data science” uses scientific systems, algorithms, and processes to extract knowledge and conclusions from both structured and unstructured data. It uses several techniques, such as data mining, machine learning, and statistical analysis, to uncover patterns, trends, and relationships in data that can inform decisions and affect business outcomes.
- Define Overfitting in Machine Learning.
A Machine Learning model becomes overfitted and begins to detect noise or sporadic oscillations in the data rather than underlying patterns when it learns the training set too well. As a result, the model works effectively with training data but needs to improve with fresh, untested data. Techniques like feature selection, regularization, and cross-validation can help reduce overfitting.
- What is the Curse of Dimensionality?
The curse of dimensionality describes the phenomenon where some algorithms become less effective with more features or dimensions in the data. This results from the sparseness (fewer data points in high-dimensional spaces), making it challenging to conclude training data. The dimensionality curse can be lessened with feature selection, dimensionality reduction, and data pretreatment.
- Differentiate between Classification and Regression.
| Classification | Regression |
| Classification aims to assign a categorical label or class to every input example. Binary classification, like in spam detection, and multi-class classification, such as picture classification. | Regression aims to forecast a continuous numerical value for every supplied example. Predicting the value of stocks or homes are two examples. |
- Explain the function of Feature Engineering in Machine Learning.
The process of choosing, altering, and producing new features from the raw data to enhance the functionality of machine learning models is known as feature engineering. Improved feature engineering can improve the model’s prediction performance by helping it identify pertinent patterns and correlations in the data. Scaling, normalizing, encoding categorical variables, and generating interaction terms are some of the Feature Engineering strategies.
Intermediate Data Scientist Interview Questions and Answers:
- Define Cross-validation and describe its importance.
Using various subsets (folds) of the data, training the model on one subset, and evaluating it on the remaining subset is how the cross-validation technique analyzes the performance of a machine learning model. Every fold serves as the training and test set, and this procedure is repeated numerous times.
Importance: Cross-validation is crucial since it helps identify problems like overfitting and offers a more accurate assessment of the model’s performance.
- Define Regularization in the context of Machine Learning.
Regularization is a technique that penalizes big coefficients or complex models by adding a penalty term to the loss function, hence preventing overfitting in machine learning models. Common types of regularization include L1 regularization (Lasso), which encourages sparsity by shrinking some coefficients to zero, and L2 regularization (Ridge), which penalizes the squared magnitude of coefficients.
- Define Clustering in Unsupervised Learning.
In unsupervised learning, the clustering algorithm groups related data points according to their characteristics. Finding hidden patterns/ structures in the data, such as logical groups or clusters, is the goal of clustering. K-means, hierarchical clustering, and DBSCAN are examples of common clustering techniques.
- Explain various types of Clustering algorithms and describe how they vary from each other.
In unsupervised learning, clustering algorithms are used to put similar data points together according to their characteristics. Common types of clustering algorithms include K-means, hierarchical clustering, and DBSCAN.
| K-means | Hierarchical clustering | DBSCAN |
| K-means partitions the data into K clusters by minimizing the within-cluster variance. | By repeatedly joining or dividing clusters, hierarchical clustering creates a hierarchy of clusters. | DBSCAN identifies clusters based on density connectivity. |
- Explain Feature Selection and describe its importance in Machine Learning.
The process of selecting a subset of pertinent characteristics from the initial collection of features in order to enhance machine learning model performance is known as feature selection.

Importance: It helps reduce overfitting, improve model interpretability, and reduce computational complexity. Feature selection techniques include:
- Filter methods (e.g., correlation analysis).
- Wrapper methods (e.g., recursive feature elimination).
- Embedded methods (e.g., Lasso regularization).
Frequently Asked Data Scientist Interview Questions and Answers:
- Differentiate between Data Analytics and Data Science.
| Data Analytics | Data Science |
| Data Analytics examines datasets to conclude the information they contain. It is more about processing and performing statistical analysis on existing datasets. The goal is to find actionable insights and solve specific business problems using historical data. | Data Science encompasses a broader scope that includes data analytics but also involves developing algorithms, predictive models, and new methodologies to process and analyze data. It combines domain expertise, programming skills, and knowledge of mathematics & statistics to obtain meaningful insights and predictions from data. |
- What are the differences between supervised and unsupervised learning?
| Supervised Learning | Unsupervised Learning |
| A labeled dataset is used for supervised learning, where each training example has an output label associated with it. Learning a mapping from inputs to outputs is the aim. Tasks involving regression and classification are two examples. | Training a model with unlabeled data entails unsupervised learning. Deducing the inherent structure from data points is the aim. Tasks involving association and clustering are two examples. |
- Explain the steps in making a decision tree.
- Step 1 –Select the Best Attribute: Choose the attribute that best separates the data according to some criterion (e.g., Gini impurity, information gain).
- Step 2 –Create Decision Nodes and Leaf Nodes: The selected attribute will split the dataset into subsets. Each branch of the split represents a possible value of the attribute.
- Step 3 – Repeat the Process: Recursively apply the same process to each branch, using only the data that reaches that branch.
- Step 4 –Termination Condition: When any of the following conditions is satisfied, all instances within a node are members of the same class, there are no more attributes to divide, or some other predetermined stopping criteria is met, the recursion should come to an end.
- Differentiate between univariate, bivariate, and multivariate analysis.
| Univariate Analysis | Bivariate Analysis | Multivariate Analysis |
| Univariate Analysis involves examining and analyzing a single variable. The purpose is to describe the data and find patterns within it. | Bivariate Analysis involves analyzing two variables to determine their empirical relationship. It typically includes methods like correlation, regression, and cross-tabulation. | Multivariate analysis is the process of looking at more than two variables at once. It makes use of methods like factor analysis, multiple regression, and (MANOVA) to understand the connections between numerous variables. |
- How should you maintain a deployed model?
- Regular Monitoring: Continuously monitor the model’s performance in production to ensure it is performing as expected.
- Periodic Retraining: Retrain the model periodically with new data to maintain accuracy and relevance.
- Data Drift Analysis: Analyze the incoming data for any drift or pattern change affecting model performance.
- Version Control: Keep track of different versions of the model and data and have a rollback mechanism if a new version underperforms.
- Performance Metrics: Regularly check and compare key performance metrics with established benchmarks.
- Feedback Loop: Incorporate user feedback and real-world outcomes to improve the model continually.
- What is a Confusion Matrix?
A table used to assess a classification model’s performance is called a confusion matrix. It shows the actual versus predicted classifications and includes true positives (TP), true negatives (TN), false positives (FP), and false negatives (FN). This matrix helps to understand the model’s accuracy, precision, recall, and overall performance.
- How is logistic regression done?
Logistic regression is done by modeling the probability that a given input belongs to a particular class. It maps anticipated values to probabilities using the logistic function, often referred to as the sigmoid function. The steps include:
- Preparing the dataset and encoding categorical variables.
- Defining the logistic regression model.
- Estimating the coefficients using maximum likelihood estimation.
- Making predictions based on the logistic function.
- Evaluating the model’s performance using accuracy, precision, recall, and ROC-AUC metrics.
- What is the significance of p-value?
In statistical testing, the p-value expresses the strength of the evidence against the null hypothesis. A low p-value (typically ≤ 0.05) indicates strong evidence against the null hypothesis, suggesting that the observed data is unlikely under the null hypothesis. Conversely, a high p-value suggests weak evidence against the null hypothesis.
- Mention some techniques used for sampling.

- Simple Random Sampling: Every person has an equal probability of being selected using simple random sampling.
- Stratified Sampling: Based on predetermined criteria, samples are selected from each stratum, which represents a subset of the population.
- Cluster Sampling: A random sample of the clusters is chosen following the population’s division into clusters. Every person in the selected clusters makes up the sample.
- Systematic Sampling: After selecting a random beginning point, every nth person in the population is chosen.
- Convenience Sampling: The researcher selects samples from a group that is easily available to them.
- Differentiate between Precision and Recall.
| Precision | Recall |
| The ratio of genuine positive predictions to all anticipated positives is known as precision, or positive predictive value (TP / (TP + FP)). It evaluates how accurate the optimistic forecasts were. | The ratio of true positive predictions to all real positives (TP / (TP + FN)) is known as recall, or sensitivity. It gauges how well the model can locate all pertinent examples. |
In summary, precision focuses on the correctness of positive predictions, while recall focuses on the completeness of identifying positive instances.
Python-based Data Science Interview Questions and Answers for Freshers
- How is Python used in Data Science?
Python is a popular high-level interpreted programming language that is easy to learn and understand. It is well-liked in data science because of its many libraries and frameworks (such as pandas, NumPy, scikit-learn, and TensorFlow) that make data manipulation, analysis, machine learning, and visualization easier. Furthermore, Python is a powerful and approachable technology for data scientists due to its extensive documentation and vibrant community.
- Differentiate between lists and Tuples in Python.
| Lists | Tuples |
| A list is a mutable, ordered collection of items, allowing for modifications (e.g., adding, removing, or changing elements). Lists are defined using square brackets, e.g., [1, 2, 3]. | A tuple is an immutable, ordered collection of items that cannot be altered once it is created. Tuples are defined using parentheses, e.g., (1, 2, 3). |
- What are Python’s key libraries used in data science, and what are their primary functions?
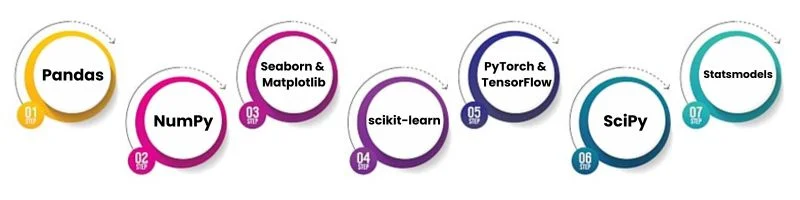
Answer: Important Python data science libraries consist of:
- Pandas: Analysis and manipulation of data.
- NumPy: Operations with arrays and numerical processing.
- Seaborn and Matplotlib: Uses Data visualization.
- scikit-learn: Preprocessing data and machine learning techniques.
- PyTorch and TensorFlow: Two deep learning frameworks.
- SciPy: Technical and scientific computing together.
- Statsmodels: Testing and statistical modeling.
- How do you handle missing data in pandas?
Missing data in Pandas can be managed with techniques like these:
- df.isnull() and df.notnull(): Identify missing values.
- df.dropna(): Remove rows or columns with missing values.
- df.fillna(): Fill missing values with a specified value or method (e.g., mean, median).
- df.interpolate(): Fill missing values using interpolation.
- What is a DataFrame in pandas, and how is it different from a NumPy array?
With labeled axes (rows and columns), a DataFrame is a two-dimensional, size-mutable, and possibly heterogeneous tabular data structure in pandas. With labeled indexing and integrated techniques for resolving missing data, DataFrames provide more robust data manipulation and analysis capabilities than NumPy arrays. They can also accept mixed data types.
Intermediate Python-based Data Scientist Questions and Answers:
- Explain the concept of broadcasting in NumPy.
NumPy’s ability to execute element-wise operations on arrays of various shapes is called “broadcasting.” NumPy makes computations quick and easy by automatically expanding the smaller array to fit the shape of the larger array during operations without actually copying the data.
- What is the purpose of the groupby() function in pandas?
The groupby() function in pandas splits the data into groups based on criteria, performs a specified operation (e.g., aggregation, transformation) on each group, and then combines the results. This is useful for analyzing and summarizing data by categories.
- How do you read a CSV file into a pandas DataFrame?
A CSV file can be read into a pandas DataFrame using the pd.read_csv() function.
For Example:
df = pd.read_csv(‘file.csv’)
- What is the difference between apply() and map() functions in pandas?
A function can be applied along a data frame’s axis (rows or columns) using the pandas apply() method. It is more flexible and works with Series as well as DataFrames. Although less flexible, the map() function is easier to use for single Series operations because it applies a function to a Series element-by-element.
- Explain the concept of machine learning model evaluation in scikit-learn.

In scikit-learn, machine learning model evaluation is performed using various metrics and techniques to assess the model’s performance. Common evaluation methods include:
- Cross-validation: Splitting the data into training and testing sets multiple times to ensure robust performance assessment.
- Confusion matrix: Evaluating classification models by comparing predicted and actual labels.
- Metrics: Using accuracy, precision, recall, F1-score for classification models, and mean squared error (MSE), R-squared for regression models.
- train_test_split(): Function to split data into training and testing sets.
Java-based Data Science Interview Questions and Answers
- What is Apache Spark, and why is it important in data science?
The open-source distributed computing platform Apache Spark aims to compute quickly. It provides fault tolerance for entire clusters and an implicit data parallel programming interface. Because it enables in-memory processing, which significantly accelerates big data operations as compared to more traditional disk-based processing frameworks like Hadoop, Spark is essential to data science.
- Explain the role of Java in data science.
Java plays a crucial role in data science due to its performance, scalability, and extensive ecosystem of libraries and tools. Java is often used to build scalable data processing applications, integrate big data technologies like Hadoop and Spark, and deploy machine learning models in production environments.
- What are the key components of the Hadoop ecosystem, and how do they interact with Java?

The Hadoop ecosystem includes:
- HDFS (Hadoop Distributed File System): A distributed file system that stores data across multiple machines.
- MapReduce: A programming paradigm called MapReduce is used to process big datasets concurrently.
- YARN (Yet Another Resource Negotiator): A resource management layer for scheduling and managing cluster resources.
- HBase: A distributed, scalable, NoSQL database on top of HDFS.
- Hive: A data warehousing tool that provides SQL-like query language. Java is often used to write MapReduce programs, develop custom data processing applications, and interact with various Hadoop ecosystem components.
- Explain the concept of machine learning in Java using the Deeplearning4j library.
Developers may design, train, and implement deep neural networks with the help of the Java-based deep learning package Deeplearning4j. It offers various modeling tools and methods, including fully connected networks, recurrent neural networks, and convolutional neural networks (CNNs). Deeplearning4j facilitates GPU acceleration and interfaces with Spark and Hadoop for distributed training.
- How can you perform Data Visualization in Java?
Data visualization in Java can be achieved using libraries such as:
- JFreeChart: A popular library for creating charts like bar charts, pie charts, and line charts.
- JavaFX: A framework for building rich graphical user interfaces that can be used for data visualization.
- XChart: A simple library for creating quick and easy-to-use charts.
Intermediate level of Java-based Data Science Interview Questions and Answers:
- What is the role of Java in implementing ETL (Extract, Transform, Load) processes?
Java’s efficiency and resilience make it an important tool for creating ETL procedures. Frameworks for creating data pipelines that harvest data from several sources, transform it in accordance with business rules, and load it into target systems are provided by Java-based ETL tools like Apache NiFi, Talend, and Apache Camel. Java is suited for ETL processes because of its capacity to manage intricate logic and integrations.
- How does the Java library Apache Mahout support machine learning?

Apache Mahout is a scalable machine-learning library for developing and implementing machine-learning algorithms on big data platforms. It is a Java program that offers collaborative filtering, classification, and clustering solutions. Mahout facilitates the creation of unique machine-learning workflows and interfaces with Hadoop for distributed computing.
- What is the significance of using Java for building scalable Data Processing Systems?
Java’s performance, scalability, and wide ecosystem make it an important tool for developing scalable data processing systems. Java’s concurrency features, such as parallel processing and multithreading, let programmers create apps that can effectively manage massive amounts of data. Java’s integration with big data technologies, such as Hadoop and Spark, also guarantees horizontal scaling of data processing systems in dispersed contexts.
- Explain how you can use Java for real-time Data Processing.
Java can be used for real-time data processing by leveraging frameworks like Apache Kafka and Apache Storm:
- Apache Kafka: Real-time data stream processing is possible with this distributed streaming platform. Writers and consumers for publishing and consuming data from Kafka topics are written in Java.
- Apache Storm: A real-time computation system that processes data streams in real-time. Java is used to define topologies and bolts for processing and transforming data streams. These frameworks enable the development of robust real-time data processing pipelines using Java.
- Explain the difference between HDFS and HBase and how Java interacts with them.
| HDFS | HBase |
| The HDFS is a distributed file system that stores massive datasets across multiple computers to enable high performance data access. | HBase is a distributed, scalable NoSQL database that runs on top of HDFS and provides real-time read/write access to large datasets. |
Java can read and write files in HDFS and communicate with it via the Hadoop API. Java performs database operations for HBase, including table creation, data insertion, and record queries, using the HBase client API.
SQL-based Data Scientist Interview Questions and Answers
- What is SQL, and how is it used in data science?
A common programming language for administering and modifying relational databases is called SQL (Structured Query Language). In data science, SQL extracts, transforms, loads (ETL) data from databases, performs data analysis, and generates reports. SQL enables data scientists to query large datasets, join tables, filter records, and aggregate data efficiently.
- Explain the difference between SQL and NoSQL databases.
| SQL | NoSQL |
| SQL databases are relational and use structured query language (SQL) for defining and manipulating data. | NoSQL databases are non-relational and can store unstructured, semi-structured, or structured data. |
| They are based on a schema and support ACID (Atomicity, Consistency, Isolation, Durability) properties, making them suitable for complex queries and transactional operations. | They provide flexible schemas to handle large data volumes and high user loads. NoSQL databases support eventual consistency and are often used for big data applications. |
| Examples include MySQL, PostgreSQL, and Oracle. | Examples include MongoDB, Cassandra, and Redis. |
- What is a primary key in SQL, and why is it important?
A database table’s primary key serves as each record’s unique identifier. It guarantees that every record can be uniquely recognized and is unique. A primary key constraint ensures that the column or combination of columns chosen as the primary key cannot contain null values and must contain unique values. Primary keys are crucial for establishing relationships between tables and maintaining data integrity.
- How would you use SQL to join two tables? Provide an example.
To join two tables in SQL, you can use different JOIN operations, such as INNER JOIN, LEFT JOIN, RIGHT JOIN, and FULL JOIN. An INNER JOIN returns only the rows with matching values in both tables.
Here is an example:
SELECT A.column1, B.column2
FROM TableA A
INNER JOIN TableB B ON A.common_column = B.common_column;
This query selects columns from TableA and TableB where the values in common_column match.
- What is a subquery in SQL, and how is it used?
A query nested inside another query is called a subquery. It can return data used by the main query and execute intermediary processes. Statements that select, insert, update, and delete data can use subqueries.
For example:
SELECT employee_id, employee_name
FROM employees
WHERE department_id = (SELECT department_id FROM departments WHERE department_name = ‘Sales’);
This query selects employees who belong to the ‘Sales’ department.
Intermediate level of SQL-based Data Science Interview Questions And Answers For Freshers:
- Explain the difference between GROUP BY and ORDER BY clauses in SQL.
Rows with identical values in designated columns are grouped together into summary rows by the GROUP BY clause. Aggregate functions like COUNT, SUM, AVG, MAX, and MIN are frequently utilized with it.
For example:
SELECT department_id, COUNT(*)
FROM employees
GROUP BY department_id;
The result set is sorted in either descending (DESC) or ascending (ASC) order using the ORDER BY clause.
For example:
SELECT employee_name, salary
FROM employees
ORDER BY salary DESC;
This query sorts employees by their salary in descending order.
- What is a SQL window function, and give an example of how it is used.
Functions in the SQL window calculate values from other table rows that are connected to the current row. Unlike aggregate functions, they do not result in the process of combining rows into an output row. ROW_NUMBER(), which gives a distinct number to each row inside a partition of a result set, is an illustration of a window function:
For Example:
SELECT employee_id, employee_name, salary,
ROW_NUMBER() OVER (PARTITION BY department_id ORDER BY salary DESC) as row_num
FROM employees;
This query assigns a rank based on salary within each department.
- What is a CTE (Common Table Expression) in SQL, and why would you use one?
A temporary result set defined within the execution scope of a single SQL statement is known as a Common Table Expression (CTE). Complex query readability and structure are enhanced by CTEs, which can be referred to repeatedly inside the query. The WITH clause is used to define them.
As an illustration:
WITH DepartmentSales AS (
SELECT department_id, SUM(sales) AS total_sales
FROM sales
GROUP BY department_id
)
SELECT department_id, total_sales
FROM DepartmentSales
WHERE total_sales > 100000;
This query creates a CTE DepartmentSales and then uses it to filter departments with total sales greater than 100,000.
- How do you handle NULL values in SQL?
NULL values represent missing or unknown data in SQL. You can handle NULL values using functions such as IS NULL, IS NOT NULL, and NULLIF(), COALESCE(). For example, to replace NULL values with a default value:
For Example:
SELECT employee_id, COALESCE(phone_number, ‘N/A’) AS phone_number
FROM employees;
This query replaces NULL phone numbers with ‘N/A’.
- What is the difference between the HAVING and WHERE clauses in SQL?
The WHERE clause filters rows before any groupings are made, whereas the HAVING clause filters groups after the GROUP BY clause has been applied. The WHERE clause cannot contain aggregate functions, while the HAVING clause can.
For example:
SELECT department_id, COUNT(*)
FROM employees
WHERE hire_date >= ‘2020-01-01’
GROUP BY department_id
HAVING COUNT(*) > 10;
This query filters employees hired after January 1, 2020, groups them by department, and then filters out departments with fewer than 10 employees.
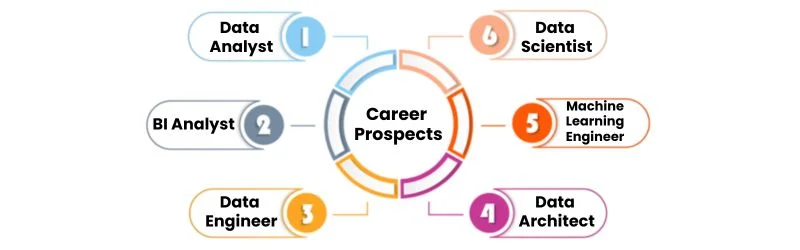
Career Prospects in Data Science
Compared to other IT industry streams, data science is one of the mainstream jobs in today’s world that has grown at a higher rate. This is due to the fact that data is pervasive and that there has been a tremendous global data explosion in recent years. Prominent firms such as IBM, Microsoft, Amazon, Infosys, Wipro, EY, Deloitte, and Cognizant are hiring for Data Scientist roles. Even though startups generate an immense amount of data, so do all businesses with a website, social media presence, electronic payment acceptance, or regular client communications via electronic devices.
In order to determine the demands and spending behaviors of users, all of these data are gathered and kept in an anonymous manner. Nothing compares to the reliability of the hard data backup you have in your system, even with the abundance of other ways that modern technological improvements might impact your organization in the market.
Data Analyst
Data analysts are often the starting point for careers in data science. They gather data, handle it, and run statistical studies on it. Data analysts create reports and dashboards using tools like SQL, Excel, Tableau, or Power BI to communicate insights that inform business decisions. This role requires a good understanding of data manipulation and basic statistical concepts. In India, entry-level data analysts can expect an annual salary ranging from ₹3,00,000 to ₹6,00,000. Candidates can explore Data Analyst job openings in Free Alert Job.
Business Intelligence (BI) Analyst
Business Intelligence Analysts analyze business data to identify trends and patterns that aid decision-making. They develop BI solutions and dashboards to make complex data accessible to non-technical stakeholders. BI Analysts use tools like Tableau, Power BI, and Looker. They collaborate closely with various departments to ensure BI solutions meet business needs. The typical annual salary for a BI Analyst in India ranges from ₹4,00,000 to ₹8,00,000.
Data Engineer
Data engineers design and maintain the data generation, storage, and processing infrastructure. They create data pipelines and ensure data is clean, reliable, and accessible for analysis. Expertise in database systems and programming languages like Python, Java, or Scala are requirements. Data engineers work with big data technologies like Hadoop, Spark, and cloud platforms. In India, data engineers earn an annual salary between ₹5,00,000 and ₹12,00,000.
Data Scientist
Data scientists use data to uncover important insights that help them tackle challenging business issues. They employ statistical analysis, machine learning, and data visualization techniques. Proficiency in programming (Python or R), strong analytical skills, and effective communication abilities are crucial. Data scientists work on diverse projects such as customer segmentation, recommendation systems, and fraud detection. In India, Annual Salary of Data Scientists can be between ₹8,00,000 and ₹20,00,000.
Machine Learning Engineer
Machine Learning Engineers specialize in developing & deploying machine learning models. They collaborate with data scientists to integrate these models into production systems. Essential skills include programming (Python or R), understanding of machine learning frameworks (TensorFlow or PyTorch), and data preprocessing techniques. Machine Learning Engineers optimize models for performance and scalability. Their annual salary in India typically ranges from ₹6,00,000 to ₹15,00,000.
Data Architect
Data architects design and manage an organization’s data architecture, ensuring systems are scalable, secure, and efficient. They define data standards and governance policies, ensuring data integrity and quality. Expertise in database design, modeling, and big data technologies is essential. Data architects collaborate with IT and business units to align data systems with organizational goals. The annual salary for data architects in India ranges from ₹15,00,000 to ₹30,00,000. Are you in search of Fresher Jobs in Mumbai? Explore a broad spectrum of job opportunities across the city.
These salary details can vary according to the candidate’s skills, experience, company, and location.
As a fresher, it’s essential to understand the technical concepts and express your thought process clearly and confidently. Remember, interviews are as much about showcasing your problem-solving approach and analytical mindset as they are about your technical skills. In this blog, we explored the top 50 Data Scientist Interview Questions and Answers to guide freshers preparing for a Data Science Interview. Explore Top 10 Data Science Training Institutes in Chennai to find the ideal Institute to enhance your skills.